

Habitat Fragmentation: Examples and Wildlife Corridors
Understand habitat loss versus fragmentation, compare India and Canada corridor evidence, and learn what a connectivity map can and cannot prove.
Habitat fragmentation is the division of habitat into separate patches. Habitat loss reduces how much habitat remains; fragmentation describes its arrangement. The two often happen together, but measuring one does not measure the other. A wildlife corridor aims to maintain or restore connections that matter to particular species or ecological processes.
A green line on a map is a proposal about movement. Evidence that animals use it, survive the journey and reproduce answers progressively different questions. This guide explains those distinctions with a simple diagram, central Indian tiger research and a Canadian wildlife-crossing study.
Habitat loss, degradation and fragmentation are different
A forest can shrink, become less suitable for a species, or be separated into patches. These changes need separate descriptions. A road may remove a small area while creating a major barrier. Conversely, two separated woodland patches may remain connected for a bird that regularly crosses the land between them.
| Change | Question | Illustrative evidence |
|---|---|---|
| Habitat loss | How much habitat has disappeared? | Comparable habitat-area measurements before and after conversion. |
| Habitat degradation | Has the remaining habitat become less suitable? | A survey of vegetation, water conditions or other features relevant to the species. |
| Fragmentation | How are the remaining patches separated? | Patch arrangement, barriers and species-specific evidence about movement. |
Haddad and colleagues' analysis of long-running fragmentation experiments documents effects of reduced area, isolation and edges across studied ecosystems. Its findings support taking these changes seriously. They do not supply a single percentage loss of biodiversity that can be assigned to every newly divided site.
Edges also matter. Conditions near a new boundary can differ from the interior, so equal mapped areas need not offer equal amounts of interior habitat. The organism and the surrounding land determine which differences matter. An ecologist should help select the relevant habitat definition before a team compares patches.
Same amount of habitat, different arrangement
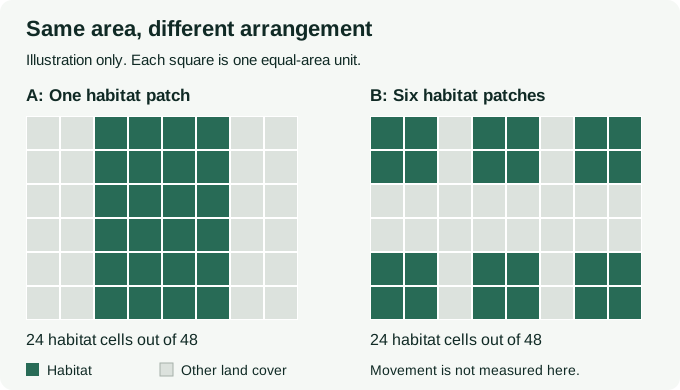
In panel A, all 24 habitat cells share a continuous block. In panel B, the same 24 cells form six separate blocks. An area-only report would record 50% habitat in both. It would miss the arrangement.
Now ask whether the grey cells are usable by the species of interest. If they are a serious barrier, B may constrain movement. If the species crosses them readily, patch separation alone may be a poor description of its experience. The diagram deliberately provides no answer about habitat quality, distance, traffic, fences or behaviour.
It also compares two arrangements rather than claiming that a real project can split habitat without losing any. Use separate area and connectivity measures in a real assessment, and document which parts of the conclusion are observations and which are assumptions.
Two examples: central Indian tigers and Banff bears
India: forest connections between tiger reserves
A 2013 genetic study of the central Indian highlands examined tiger populations associated with Kanha, Pench, Satpura and Melghat. It compared historical and contemporary gene-flow estimates and found different patterns between reserve pairs with retained connections and pairs that had lost forest connectivity.
Kanha and Pench are a useful named example of why looking beyond reserve boundaries matters. The research supports protecting connections across the wider landscape. It is historical evidence from the populations and methods studied, not a current condition assessment of every part of the corridor.
Canada: did bears using crossings also reproduce?
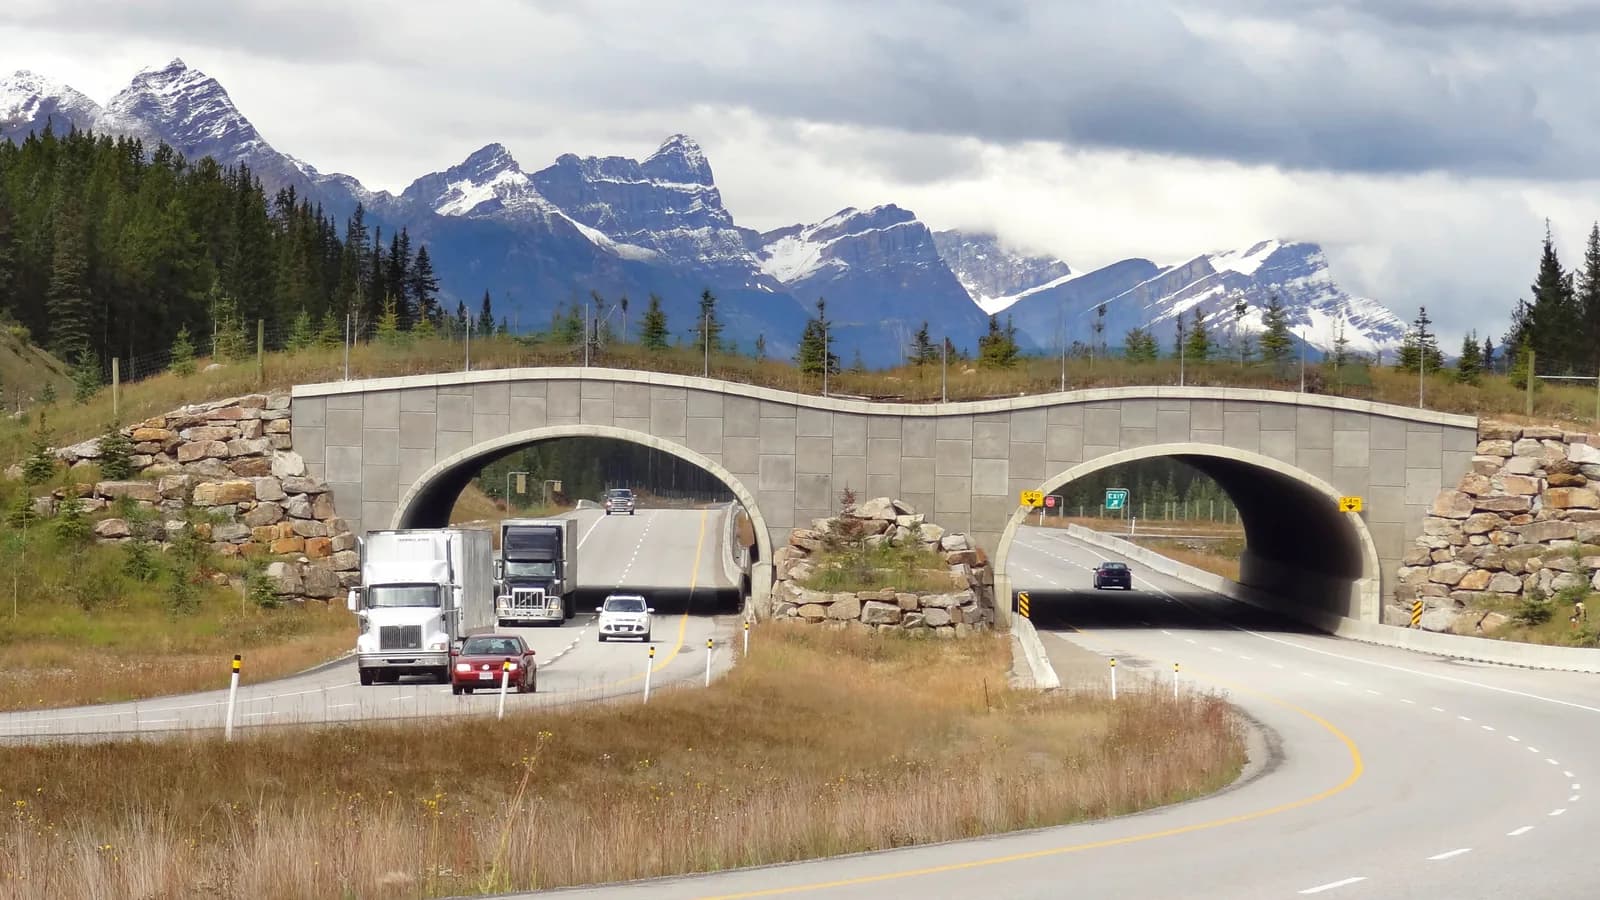
A 2014 Banff National Park study combined genetic samples from wildlife crossings and surrounding bear populations. Parentage analysis found that some black and grizzly bears using the crossings reproduced. This supported a stronger conclusion about genetic connectivity than crossing detections alone.
The study also found differences between the two bear species. A crossing design or result should therefore not be transferred to another species simply because both are mammals. The important lesson is the evidence sequence: a route exists, individuals use it, and some contribute to the population on the other side.
What can a connectivity map actually show?
IUCN's connectivity guidelines distinguish physical landscape arrangement from how organisms and processes move through it. A model can identify possible connections using habitat, barriers and assumptions about travel difficulty. It does not turn those assumptions into observed movement.
| Evidence | Useful conclusion | Remaining question |
|---|---|---|
| Habitat map | Shows classified patches and mapped barriers at a stated resolution. | Were those classes checked in the field, and do they suit the focal species? |
| Connectivity model | Suggests routes or bottlenecks under its assumptions. | How sensitive are the routes to different assumptions? |
| Camera or tracking records | Documents detections or movements during a defined survey. | Which individuals, seasons and places were missed? |
| Genetic and parentage evidence | Can test exchange and reproduction between sampled populations. | What period and population does the sampling represent? |
Five questions before accepting a corridor proposal
Consider a hypothetical project with two woodland blocks and a proposed link beside a road. A useful review note would ask:
- For which species? Name the species or ecological process the connection should support.
- What interrupts movement? Record the actual barriers, including conditions a broad land-cover map might miss.
- What supports the route? Separate local observations from modelled suitability and expert judgement.
- Who can maintain it? Identify landholders, community uses and responsibility for the route over time.
- What would change the decision? Agree which additional survey or contrary finding would require a different route or design.
For example, a line crossing a fenced boundary should remain an unresolved assumption until the team checks access. Updating the map after that check is a useful result, even if it means rejecting the first route.
Questions about fragmentation and wildlife corridors
Which animals are most affected by habitat fragmentation?
There is no universal ranking. Dependence on particular habitat, movement ability, reproduction and responses to the surrounding land all matter. Name the species before deciding which patch arrangement is a problem.
How can habitat fragmentation be reduced?
Start by avoiding additional damage to important habitat and connections. Where a barrier already exists, consider site-specific ways to improve movement and habitat condition. Evaluate the response rather than assuming that planting a strip of trees has created a functioning corridor.
Does a satellite image prove that a wildlife corridor works?
No. It can contribute evidence about physical habitat and change. Species movement and population exchange need suitable ecological observations and analysis.
To commission the underlying map, use the habitat mapping guide. For deciding what to measure on the ground, read biodiversity measurement methods. A forest-monitoring discussion should clearly separate mapped observations from any specialist wildlife survey.
Sources checked on 31 October 2026. Research examples are attributed to their original teams; the diagram and review exercise are illustrative.
Define what a habitat map needs to show
Agree habitat classes, observation dates and field checks before interpreting connectivity.
Use the habitat mapping guide