
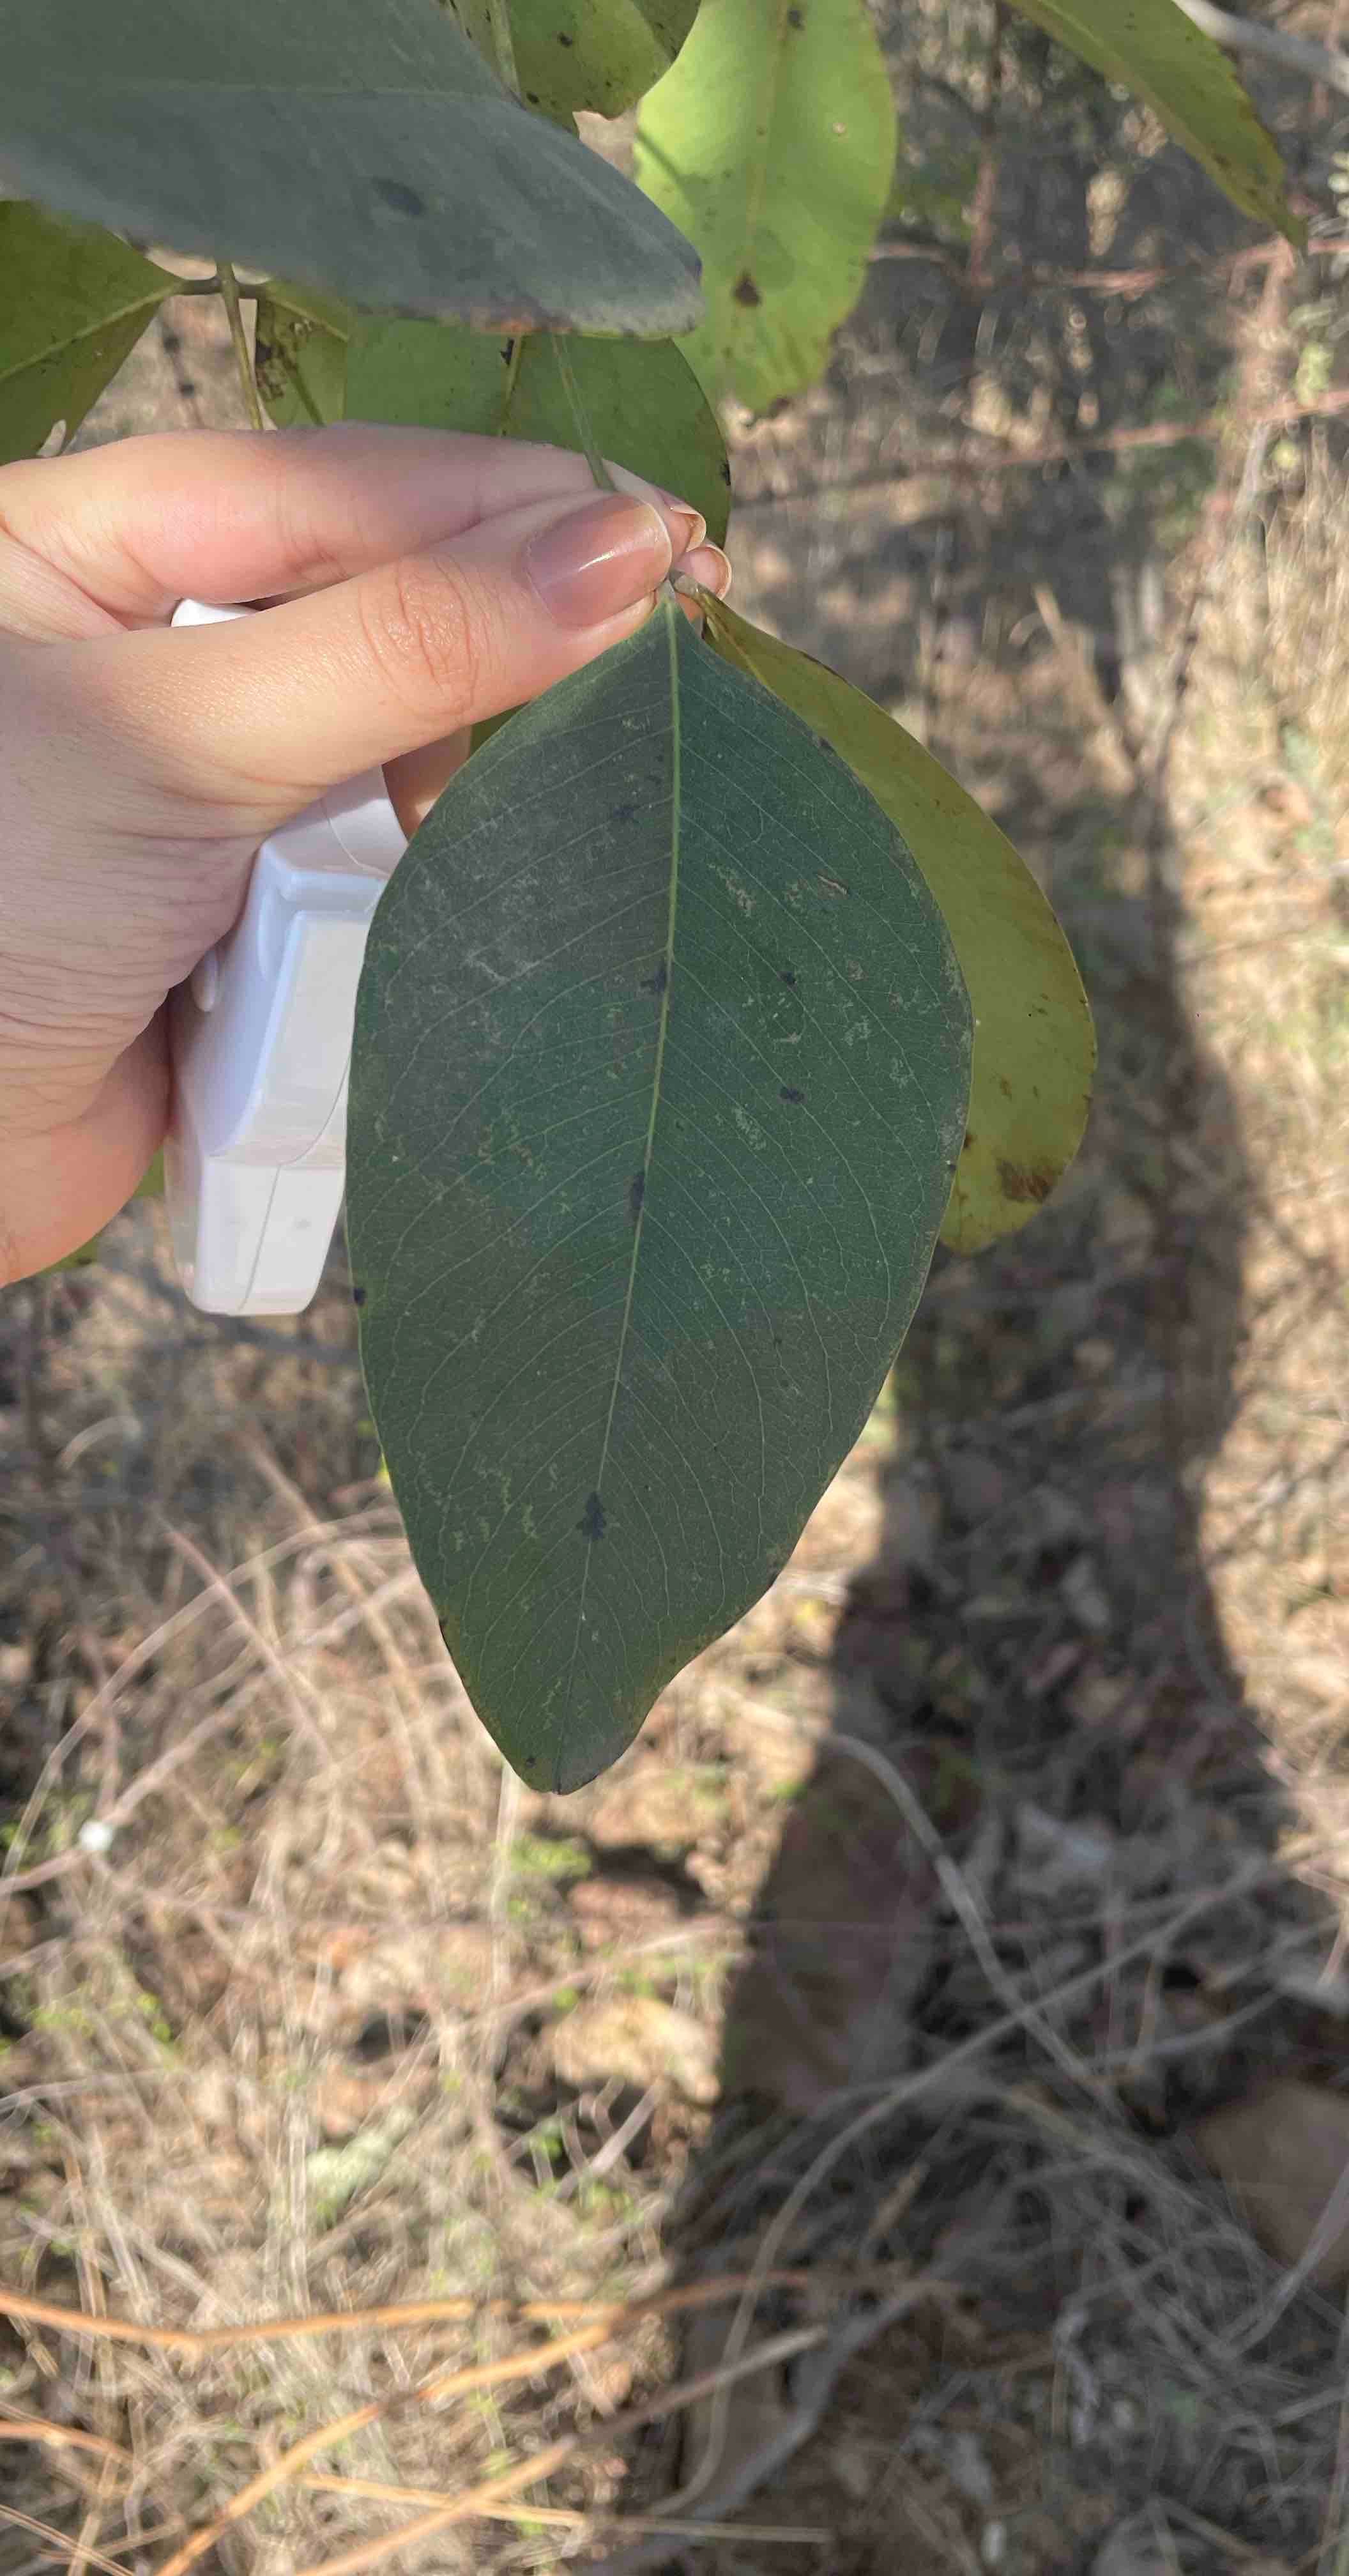
Types of Biodiversity: Genetic, Species and Ecosystem
Understand the three main types of biodiversity with clear examples, a richness and evenness comparison, and questions to ask about nature claims.
Biodiversity means the variety of living organisms and the ecological systems they form. Its three commonly taught levels are genetic diversity, the variation within species; species diversity, the variety of species and their abundance; and ecosystem diversity, the variety of ecological systems across a place. A useful explanation needs all three.
The Convention on Biological Diversity's definition explicitly includes variation within species, between species and among ecosystems. Counting birds or trees can reveal one part of biodiversity, but it cannot describe the whole subject.
The three types of biodiversity at a glance
| Level | What varies? | Simple example | What a species list misses |
|---|---|---|---|
| Genetic | Inherited variation within a species. | Different varieties of the same crop species. | How much genetic variation remains among the plants. |
| Species | The species present and their relative abundance. | A pond's plants, insects, fish and other organisms. | Numbers and population trends if only names are recorded. |
| Ecosystem | Ecological systems across a landscape or region. | A landscape containing woodland, grassland and wetlands. | Which systems remain, their extent and condition. |
These are connected levels, not competing definitions. A wetland contains species; those species contain genetic variation; and the wetland forms part of a wider landscape.
1. Genetic diversity: variation within a species
Genetic diversity concerns inherited differences among individuals and populations. Plants can belong to one species while carrying different combinations of genes. Visible differences may offer clues, but appearance alone does not measure genetic diversity: growing conditions can also change how an organism looks.
Crop varieties make the distinction familiar. A collection of rice varieties is not automatically a collection of different rice species. It may preserve variation within one cultivated species. FAO's account of agricultural biodiversity includes traditional varieties, modern cultivars, crop wild relatives and the other organisms that support production.
Why does that variation matter? Breeding and adaptation depend on available inherited traits. Different varieties can provide options when growing conditions or disease pressures change. This does not mean any mixed planting is guaranteed to withstand drought; the relevant traits, environment and management still matter.
The International Fund for Agricultural Development describes community seed banks in Brazil that preserve plant varieties. Their value is not captured by simply reporting how many crop species are stored. The variety information is part of the conservation record.
2. Species diversity: more than a count
Species richness is the number of species in a defined sample or area. Evenness describes how evenly individuals are distributed among those species. The US National Park Service's Yellowstone explanation discusses both species numbers and abundance when describing biodiversity.
Consider two imaginary surveys, each with 40 recorded individuals from four species. In sample A, the counts are 10, 10, 10 and 10. In sample B, they are 34, 2, 2 and 2. Both have richness of four. Sample A is more even; sample B is dominated by one species. The arithmetic is a teaching example, not a field result.
This distinction answers a recurring question in public ecology discussions about diversity indices: why can two measures give different impressions of a community? Measures weight different features. A single score needs an explanation of what was counted and how the score was calculated.
Evenness still does not tell us which species are present. Nor does a larger species count automatically establish that a habitat is in better condition. A survey should retain species identities, abundance and ecological context, rather than replacing them with an unexplained league table.
3. Ecosystem diversity: variety across the landscape
An ecosystem includes living communities and the non-living environment with which they interact. Water, soil and climate belong in that picture. Ecosystem diversity asks about the variety of such systems across the area being considered.
India provides an intuitive way to think about scale: a national discussion can consider deserts, forests, grasslands, rivers, wetlands and coastal systems. A neighbourhood study might distinguish a pond, its wet margin and nearby woodland. The classification and scale should be stated so that readers know what is being compared.
IFAD's explanation uses ecosystems ranging from steppes to mangrove swamps to show why biodiversity extends beyond species lists. The ecological variety of a landscape cannot be inferred just from how green it looks. Explore what makes a wetland and mangroves in India for two related examples.
It also helps to separate extent from condition. A map showing the same wetland boundary in two years does not, by itself, show whether its organisms, water regime or pressures stayed the same. The boundary answers an area question; condition requires its own evidence.
One farming landscape, three different questions
Imagine a village landscape with cropped fields, a pond and patches of woody vegetation. This is an original learning example, not a description of a measured Mynzo site.
- At the genetic level: which varieties of each crop are grown and retained for future sowing?
- At the species level: which plants and animals have been recorded, and what do repeat surveys show about their abundance?
- At the ecosystem level: which habitat systems are present, and are their extent and condition changing?
A change can affect one level without giving a complete answer at the others. Adding another variety of an existing crop does not add a new species. Finding another bird species does not prove that the pond is recovering. Keeping the questions separate makes the evidence more informative.
For the farming context, continue to regenerative agriculture. For the organisms and carbon processes beneath the surface, read the soil carbon guide. Neither crop output nor soil carbon alone represents every aspect of biodiversity.
How to read a biodiversity claim
GEO BON's Essential Biodiversity Variables organise observations across multiple dimensions, including genetics, species populations, community composition and ecosystem characteristics. That breadth explains why a tree count is an incomplete biodiversity report.
When you encounter a claim that biodiversity increased, ask which organisms or systems were assessed, over what area, during which dates and with what method. Ask whether the comparison used similar survey effort and whether uncertain identifications were retained as uncertain.
For your own learning, keep a dated observation notebook. Record where you looked, how long you spent, the habitat and what you could identify. A blank entry means you did not record something during that visit; it is not proof that the species never uses the site. A formal project needs a survey method appropriate to its question.
Common questions about biodiversity
Does biodiversity include fungi and microorganisms?
Yes. The National Park Service's definition explicitly includes less visible life. A guide that only names large animals leaves out much of the subject.
Are biodiversity and ecosystem services the same?
No. Biodiversity describes life's variety. Ecosystem services describe benefits people obtain from ecosystems. The concepts are connected, but a benefit such as shade is not a complete measure of biodiversity.
Is a biodiversity hotspot simply a place with many species?
The formal conservation label has specific criteria concerning endemic plants and habitat loss. Our India hotspot guide explains those criteria and the four regions that overlap the country.
Sources checked on 8 October 2026. Examples with invented survey counts are labelled as teaching examples. For practical measurement, see biodiversity metrics for restoration projects.
Turn biodiversity concepts into useful measurements
Learn what different indicators can tell you, and where field evidence matters.
Explore biodiversity metrics